Метрики Qrator (Qrator Exporter)
В очередной раз пришлось настраивать сбор метрик с Qrator, прошлая моя заметка на этот счет жила в виде Issue в репозитории StupidScience/qrator-exporter (в проекте используются deprecated-методы), но там она пропала, поэтому опишу здесь, чтобы уж точно не потерялось.

Сбор данных будет осуществляться через telegraf и, с помощью него же, отдаваться в виде метрик формата Prometheus.
Для начала потребуется получить API-токен для получения данных из Qrator, для этого переходим в раздел с ключами в личном кабинете и выпускаем токен.
Далее переходим в список доменов и сохраняем их идентификаторы, по ним будет обращение к методам API:
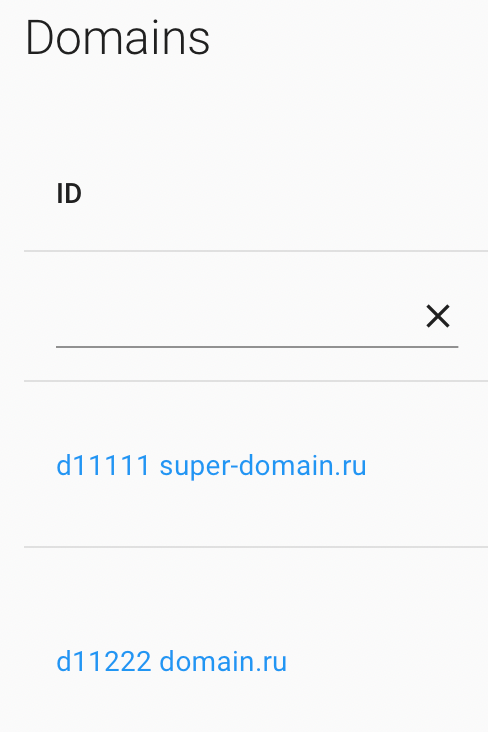
Здесь 11111 и 11222 – как раз те самые идентификаторы доменов, теперь описываем конфигурацию для телеграфа:
[[inputs.http]]
	name_prefix = "qrator_blocks_"
	method = "POST"
	urls = [
		"https://api.qrator.net/request/domain/11111",
		"https://api.qrator.net/request/domain/11222",
	]
	headers = {"X-Qrator-Auth" = "${QRATOR_API_KEY}", "Content-Type" = "application/json"}
	body = '{"method":"statistics_current_blocks"}'
	data_format = "json"
	timeout = "30s"

[[inputs.http]]
	name_prefix = "qrator_http_"
	method = "POST"
	urls = [
		"https://api.qrator.net/request/domain/11111",
		"https://api.qrator.net/request/domain/11222",
	]
	headers = {"X-Qrator-Auth" = "${QRATOR_API_KEY}", "Content-Type" = "application/json"}
	body = '{"method":"statistics_current_http"}'
	data_format = "json"
	timeout = "30s"

[[inputs.http]]
	name_prefix = "qrator_ip_"
	method = "POST"
	urls = [
		"https://api.qrator.net/request/domain/11111",
		"https://api.qrator.net/request/domain/11222",
	]
	headers = {"X-Qrator-Auth" = "${QRATOR_API_KEY}", "Content-Type" = "application/json"}
	body = '{"method":"statistics_current_ip"}'
	data_format = "json"
	timeout = "30s"

[[inputs.http]]
	name_prefix = "qrator_locations_"
	method = "POST"
	urls = [
		"https://api.qrator.net/request/domain/11111",
		"https://api.qrator.net/request/domain/11222",
	]
	headers = {"X-Qrator-Auth" = "${QRATOR_API_KEY}", "Content-Type" = "application/json"}
	body = '{"method":"statistics_current_locations"}'
	data_format = "json"
	timeout = "30s"

[[outputs.prometheus_client]]
	listen = ":9273"
В поле urls передается массив из ссылок на ресурсы (включают в себя идентификаторы доменов), в поле body – метод, а для передачи API-ключа используется переменная окружения QRATOR_API_KEY, нам нужно будет её дополнительно передать телеграфу, чтобы не хранять напрямую в конфигурации.
Осталось только запустить. Минифицированный Deployment для kustomize может выглядеть так:
---
apiVersion: apps/v1
kind: Deployment
metadata:
  name: qrator-exporter
spec:
  template:
    spec:
      containers:
        - name: telegraf
          image: telegraf:1.21.4
          ports:
            - name: metrics
              containerPort: 9273
          env:
            - name: QRATOR_API_KEY
              value: CHANGE_ME
          securityContext:
            runAsUser: 1001
            capabilities:
              drop:
                - ALL
            readOnlyRootFilesystem: true
            runAsNonRoot: true
          volumeMounts:
            - name: config
              mountPath: "/etc/telegraf"
              readOnly: true
            - name: cache
              mountPath: "/.cache"
      volumes:
        - name: config
          secret:
            secretName: qrator-exporter
        - name: cache
          emptyDir: {}
Сам секрет qrator-exporter описывается в файле kustomization.yaml, например:
secretGenerator:
  - name: qrator-exporter
    files:
      - config/telegraf.conf
Не забываем описать сервис и Service Monitor:
---
apiVersion: v1
kind: Service
metadata:
  name: qrator-exporter
spec:
  type: ClusterIP
  ports:
    - name: metrics
      port: 9273
      targetPort: 9273
---
apiVersion: monitoring.coreos.com/v1
kind: ServiceMonitor
metadata:
  name: qrator-exporter
spec:
  endpoints:
    - interval: 30s
      path: /metrics
      port: metrics
  selector:
    matchLabels:
      app.kubernetes.io/name: qrator-exporter
      app.kubernetes.io/component: service
      app.kubernetes.io/part-of: monitoring
  namespaceSelector:
    any: true
Селектор по лейблам, которые заданы в kustomization.yaml:
---
commonLabels:
  app.kubernetes.io/name: qrator-exporter
  app.kubernetes.io/component: service
  app.kubernetes.io/part-of: monitoring
После этого мы начнем собирать метрики, однако в качестве url в метриках будет непонятный адрес ресурса Qrator, поэтому добавляем релейбл:
---
apiVersion: monitoring.coreos.com/v1
kind: ServiceMonitor
metadata:
  name: qrator-exporter
spec:
  endpoints:
    - interval: 30s
      path: /metrics
      port: metrics
      metricRelabelings:
        - sourceLabels: ["url"]
          regex: https://api.qrator.net/request/domain/(.+)
          replacement: $1
          targetLabel: domain_id
          action: replace
        - sourceLabels: ["url"]
          regex: https://api.qrator.net/request/domain/11111
          replacement: domain.ru
          targetLabel: domain_name
          action: replace
        - sourceLabels: ["url"]
          regex: https://api.qrator.net/request/domain/11222
          replacement: super-domain.ru
          targetLabel: domain_name
          action: replace
  selector:
    matchLabels:
      app.kubernetes.io/name: qrator-exporter
      app.kubernetes.io/component: service
      app.kubernetes.io/part-of: monitoring
  namespaceSelector:
    any: true
Теперь в domain_name будет читаемый параметр, который можно использовать для селекторов в Grafana или в алертах.
Примеры алертов для Prometheus Operator:
---
apiVersion: monitoring.coreos.com/v1
kind: PrometheusRule
metadata:
  name: qrator-exporter
  labels:
    app: prometheus-operator
    release: "monitoring"
spec:
  groups:
    - name: QratorExporter
      rules:
        - alert: QratorHighBandwidthInput
          expr: qrator_ip_http_result_bandwidth_input > 5000000
          for: 5m
          labels:
            severity: warning
            domain: "{{ $labels.domain_name }}"
          annotations:
            summary: Большой входящий трафик на {{ $labels.domain_name }}
            description: На домене {{ $labels.domain_name }} в Qrator фиксируется повышенный входящий трафик, более 5Мбит/с
        - alert: QratorHighBandwidthOutput
          expr: qrator_ip_http_result_bandwidth_input > 5000000
          for: 5m
          labels:
            severity: warning
            domain: "{{ $labels.domain_name }}"
          annotations:
            summary: Большой исходящий трафик на {{ $labels.domain_name }}
            description: На домене {{ $labels.domain_name }} в Qrator фиксируется повышенный исходящий трафик, более 5Мбит/с
        - alert: QratorHigh5xxRate
          expr: qrator_http_http_result_errors_total >= 0.1
          for: 5m
          labels:
            severity: critical
            domain: "{{ $labels.domain_name }}"
          annotations:
            summary: В Qrator на {{ $labels.domain_name }} фиксируется рост числа ошибок
            description: В Qrator на домене {{ $labels.domain_name }} в течении 5 минут фиксируется рост числа 50x ошибок
Перед добавлением алертов стандартная рекомендация – пособирайте некоторые время метрики, чтобы определить для себя граничные значения, удобнее всего за этим наблюдать в Grafana, поэтому в качестве базового можно взять этот дашборд:
{
"annotations": {
"list": [
{
"builtIn": 1,
"datasource": "-- Grafana --",
"enable": true,
"hide": true,
"iconColor": "rgba(0, 211, 255, 1)",
"name": "Annotations & Alerts",
"target": {
"limit": 100,
"matchAny": false,
"tags": [],
"type": "dashboard"
},
"type": "dashboard"
}
]
},
"editable": true,
"fiscalYearStartMonth": 0,
"gnetId": null,
"graphTooltip": 1,
"id": 106,
"iteration": 1647973063127,
"links": [],
"liveNow": false,
"panels": [
{
"datasource": null,
"description": "Alerts:\n\n* QratorHighBandwidthInput\n",
"fieldConfig": {
"defaults": {
"color": {
"mode": "palette-classic"
},
"custom": {
"axisLabel": "",
"axisPlacement": "auto",
"barAlignment": 0,
"drawStyle": "line",
"fillOpacity": 0,
"gradientMode": "none",
"hideFrom": {
"legend": false,
"tooltip": false,
"viz": false
},
"lineInterpolation": "linear",
"lineWidth": 1,
"pointSize": 5,
"scaleDistribution": {
"type": "linear"
},
"showPoints": "auto",
"spanNulls": false,
"stacking": {
"group": "A",
"mode": "none"
},
"thresholdsStyle": {
"mode": "off"
}
},
"mappings": [],
"thresholds": {
"mode": "absolute",
"steps": [
{
"color": "green",
"value": null
},
{
"color": "red",
"value": 80
}
]
},
"unit": "bits"
},
"overrides": []
},
"gridPos": {
"h": 9,
"w": 12,
"x": 0,
"y": 0
},
"id": 2,
"options": {
"legend": {
"calcs": [
"max"
],
"displayMode": "list",
"placement": "bottom"
},
"tooltip": {
"mode": "multi"
}
},
"targets": [
{
"exemplar": true,
"expr": "sum(qrator_ip_http_result_bandwidth_input{domain_name=\"$domain\"})",
"interval": "",
"legendFormat": "input",
"refId": "A"
},
{
"exemplar": true,
"expr": "sum(qrator_ip_http_result_bandwidth_output{domain_name=\"$domain\"})",
"hide": false,
"interval": "",
"legendFormat": "output",
"refId": "B"
}
],
"title": "Traffic",
"type": "timeseries"
},
{
"datasource": null,
"description": "Alerts:\n\n* QratorHigh5xxRate",
"fieldConfig": {
"defaults": {
"color": {
"mode": "palette-classic"
},
"custom": {
"axisLabel": "",
"axisPlacement": "auto",
"barAlignment": 0,
"drawStyle": "line",
"fillOpacity": 0,
"gradientMode": "none",
"hideFrom": {
"legend": false,
"tooltip": false,
"viz": false
},
"lineInterpolation": "linear",
"lineWidth": 1,
"pointSize": 5,
"scaleDistribution": {
"type": "linear"
},
"showPoints": "auto",
"spanNulls": false,
"stacking": {
"group": "A",
"mode": "none"
},
"thresholdsStyle": {
"mode": "off"
}
},
"decimals": 2,
"mappings": [],
"thresholds": {
"mode": "absolute",
"steps": [
{
"color": "green",
"value": null
},
{
"color": "red",
"value": 80
}
]
},
"unit": "reqps"
},
"overrides": []
},
"gridPos": {
"h": 9,
"w": 12,
"x": 12,
"y": 0
},
"id": 4,
"options": {
"legend": {
"calcs": [],
"displayMode": "list",
"placement": "bottom"
},
"tooltip": {
"mode": "multi"
}
},
"targets": [
{
"exemplar": true,
"expr": "sum({__name__=~\"qrator_http_http_result_errors_.+\", domain_name=\"$domain\"})by(__name__)",
"interval": "",
"legendFormat": "{{ __name__ }}",
"refId": "A"
}
],
"title": "Errors",
"transformations": [
{
"id": "renameByRegex",
"options": {
"regex": "qrator_http_http_result_errors_(.*)",
"renamePattern": "$1"
}
}
],
"type": "timeseries"
},
{
"datasource": null,
"fieldConfig": {
"defaults": {
"color": {
"mode": "palette-classic"
},
"custom": {
"axisLabel": "",
"axisPlacement": "auto",
"barAlignment": 0,
"drawStyle": "line",
"fillOpacity": 0,
"gradientMode": "none",
"hideFrom": {
"legend": false,
"tooltip": false,
"viz": false
},
"lineInterpolation": "linear",
"lineWidth": 1,
"pointSize": 5,
"scaleDistribution": {
"type": "linear"
},
"showPoints": "auto",
"spanNulls": false,
"stacking": {
"group": "A",
"mode": "none"
},
"thresholdsStyle": {
"mode": "off"
}
},
"mappings": [],
"thresholds": {
"mode": "absolute",
"steps": [
{
"color": "green",
"value": null
},
{
"color": "red",
"value": 80
}
]
},
"unit": "reqps"
},
"overrides": []
},
"gridPos": {
"h": 9,
"w": 12,
"x": 0,
"y": 9
},
"id": 7,
"options": {
"legend": {
"calcs": [],
"displayMode": "list",
"placement": "bottom"
},
"tooltip": {
"mode": "single"
}
},
"targets": [
{
"exemplar": true,
"expr": "sum(qrator_http_http_result_requests{domain_name=\"$domain\"})",
"interval": "",
"legendFormat": "total",
"refId": "A"
}
],
"title": "Requests",
"transformations": [
{
"id": "renameByRegex",
"options": {
"regex": "qrator_http_http_result_responses_0000_0(.*)",
"renamePattern": "Less $1 ms"
}
},
{
"id": "renameByRegex",
"options": {
"regex": "qrator_http_http_result_responses_0(.*)_0(.*)",
"renamePattern": "$1 - $2 ms"
}
},
{
"id": "renameByRegex",
"options": {
"regex": "qrator_http_http_result_responses_0(.*)_(.*)",
"renamePattern": "$1 - $2 ms"
}
},
{
"id": "renameByRegex",
"options": {
"regex": "qrator_http_http_result_responses_1000_1500",
"renamePattern": "1 - 1.5 s"
}
},
{
"id": "renameByRegex",
"options": {
"regex": "qrator_http_http_result_responses_1500_2000",
"renamePattern": "1.5 - 2 s"
}
},
{
"id": "renameByRegex",
"options": {
"regex": "qrator_http_http_result_responses_2000_5000",
"renamePattern": "2 - 5 s"
}
},
{
"id": "renameByRegex",
"options": {
"regex": "qrator_http_http_result_responses_5000_inf",
"renamePattern": "More 5 s"
}
}
],
"type": "timeseries"
},
{
"datasource": null,
"fieldConfig": {
"defaults": {
"color": {
"mode": "palette-classic"
},
"custom": {
"axisLabel": "",
"axisPlacement": "auto",
"barAlignment": 0,
"drawStyle": "line",
"fillOpacity": 0,
"gradientMode": "none",
"hideFrom": {
"legend": false,
"tooltip": false,
"viz": false
},
"lineInterpolation": "linear",
"lineWidth": 1,
"pointSize": 5,
"scaleDistribution": {
"type": "linear"
},
"showPoints": "auto",
"spanNulls": false,
"stacking": {
"group": "A",
"mode": "none"
},
"thresholdsStyle": {
"mode": "off"
}
},
"mappings": [],
"thresholds": {
"mode": "absolute",
"steps": [
{
"color": "green",
"value": null
},
{
"color": "red",
"value": 80
}
]
},
"unit": "reqps"
},
"overrides": []
},
"gridPos": {
"h": 9,
"w": 12,
"x": 12,
"y": 9
},
"id": 10,
"options": {
"legend": {
"calcs": [],
"displayMode": "list",
"placement": "bottom"
},
"tooltip": {
"mode": "single"
}
},
"targets": [
{
"exemplar": true,
"expr": "sum({__name__=~\"qrator_http_http_result_responses_.+\", domain_name=\"$domain\"})by(__name__)",
"interval": "",
"legendFormat": "{{ __name__ }}",
"refId": "A"
}
],
"title": "Requests by response time",
"transformations": [
{
"id": "renameByRegex",
"options": {
"regex": "qrator_http_http_result_responses_0000_0(.*)",
"renamePattern": "Less $1 ms"
}
},
{
"id": "renameByRegex",
"options": {
"regex": "qrator_http_http_result_responses_0(.*)_0(.*)",
"renamePattern": "$1 - $2 ms"
}
},
{
"id": "renameByRegex",
"options": {
"regex": "qrator_http_http_result_responses_0(.*)_(.*)",
"renamePattern": "$1 - $2 ms"
}
},
{
"id": "renameByRegex",
"options": {
"regex": "qrator_http_http_result_responses_1000_1500",
"renamePattern": "1 - 1.5 s"
}
},
{
"id": "renameByRegex",
"options": {
"regex": "qrator_http_http_result_responses_1500_2000",
"renamePattern": "1.5 - 2 s"
}
},
{
"id": "renameByRegex",
"options": {
"regex": "qrator_http_http_result_responses_2000_5000",
"renamePattern": "2 - 5 s"
}
},
{
"id": "renameByRegex",
"options": {
"regex": "qrator_http_http_result_responses_5000_inf",
"renamePattern": "More 5 s"
}
}
],
"type": "timeseries"
},
{
"datasource": null,
"fieldConfig": {
"defaults": {
"color": {
"mode": "palette-classic"
},
"custom": {
"axisLabel": "",
"axisPlacement": "auto",
"barAlignment": 0,
"drawStyle": "line",
"fillOpacity": 0,
"gradientMode": "none",
"hideFrom": {
"legend": false,
"tooltip": false,
"viz": false
},
"lineInterpolation": "linear",
"lineWidth": 1,
"pointSize": 5,
"scaleDistribution": {
"type": "linear"
},
"showPoints": "auto",
"spanNulls": false,
"stacking": {
"group": "A",
"mode": "none"
},
"thresholdsStyle": {
"mode": "off"
}
},
"mappings": [],
"thresholds": {
"mode": "absolute",
"steps": [
{
"color": "green",
"value": null
},
{
"color": "red",
"value": 80
}
]
},
"unit": "pps"
},
"overrides": []
},
"gridPos": {
"h": 9,
"w": 12,
"x": 0,
"y": 18
},
"id": 11,
"options": {
"legend": {
"calcs": [],
"displayMode": "list",
"placement": "bottom"
},
"tooltip": {
"mode": "multi"
}
},
"targets": [
{
"exemplar": true,
"expr": "sum(qrator_ip_http_result_packets_input{domain_name=\"$domain\"})",
"interval": "",
"legendFormat": "input",
"refId": "A"
},
{
"exemplar": true,
"expr": "sum(qrator_ip_http_result_packets_output{domain_name=\"$domain\"})",
"hide": false,
"interval": "",
"legendFormat": "output",
"refId": "B"
}
],
"title": "Packets",
"transformations": [
{
"id": "renameByRegex",
"options": {
"regex": "qrator_http_http_result_responses_0000_0(.*)",
"renamePattern": "Less $1 ms"
}
},
{
"id": "renameByRegex",
"options": {
"regex": "qrator_http_http_result_responses_0(.*)_0(.*)",
"renamePattern": "$1 - $2 ms"
}
},
{
"id": "renameByRegex",
"options": {
"regex": "qrator_http_http_result_responses_0(.*)_(.*)",
"renamePattern": "$1 - $2 ms"
}
},
{
"id": "renameByRegex",
"options": {
"regex": "qrator_http_http_result_responses_1000_1500",
"renamePattern": "1 - 1.5 s"
}
},
{
"id": "renameByRegex",
"options": {
"regex": "qrator_http_http_result_responses_1500_2000",
"renamePattern": "1.5 - 2 s"
}
},
{
"id": "renameByRegex",
"options": {
"regex": "qrator_http_http_result_responses_2000_5000",
"renamePattern": "2 - 5 s"
}
},
{
"id": "renameByRegex",
"options": {
"regex": "qrator_http_http_result_responses_5000_inf",
"renamePattern": "More 5 s"
}
}
],
"type": "timeseries"
},
{
"datasource": null,
"fieldConfig": {
"defaults": {
"color": {
"mode": "palette-classic"
},
"custom": {
"axisLabel": "",
"axisPlacement": "auto",
"barAlignment": 0,
"drawStyle": "line",
"fillOpacity": 0,
"gradientMode": "none",
"hideFrom": {
"legend": false,
"tooltip": false,
"viz": false
},
"lineInterpolation": "linear",
"lineWidth": 1,
"pointSize": 5,
"scaleDistribution": {
"type": "linear"
},
"showPoints": "auto",
"spanNulls": false,
"stacking": {
"group": "A",
"mode": "none"
},
"thresholdsStyle": {
"mode": "off"
}
},
"mappings": [],
"thresholds": {
"mode": "absolute",
"steps": [
{
"color": "green",
"value": null
},
{
"color": "red",
"value": 80
}
]
}
},
"overrides": []
},
"gridPos": {
"h": 9,
"w": 12,
"x": 12,
"y": 18
},
"id": 5,
"options": {
"legend": {
"calcs": [
"max",
"last"
],
"displayMode": "table",
"placement": "right"
},
"tooltip": {
"mode": "single"
}
},
"targets": [
{
"exemplar": true,
"expr": "sum({__name__=~\"qrator_locations_http_result_locations_.+\", domain_name=\"$domain\"}>0)by(__name__)",
"interval": "",
"legendFormat": "{{ __name__ }}",
"refId": "A"
}
],
"title": "Black list",
"transformations": [
{
"id": "renameByRegex",
"options": {
"regex": "qrator_locations_http_result_locations_(.*)",
"renamePattern": "$1"
}
}
],
"type": "timeseries"
}
],
"schemaVersion": 32,
"style": "dark",
"tags": [
"WIP"
],
"templating": {
"list": [
{
"allValue": null,
"current": {
"selected": false,
"text": "qlean.ru",
"value": "qlean.ru"
},
"datasource": null,
"definition": "label_values(qrator_http_http_id, domain_name)",
"description": null,
"error": null,
"hide": 0,
"includeAll": false,
"label": "Domain",
"multi": false,
"name": "domain",
"options": [],
"query": {
"query": "label_values(qrator_http_http_id, domain_name)",
"refId": "StandardVariableQuery"
},
"refresh": 1,
"regex": "",
"skipUrlSync": false,
"sort": 1,
"type": "query"
}
]
},
"time": {
"from": "now-12h",
"to": "now"
},
"timepicker": {},
"timezone": "",
"title": "Qrator",
"uid": "gM2arMHnk",
"version": 23
}TODO: Перенести дашборд в https://grafana.com/grafana/dashboards/.